: In a Security Information and Event Management (SIEM) system, effective monitoring and visualization of scam events is crucial to detecting and responding to cyberattacks. Cybercriminals often use deceptive methods to exploit individuals or organizations, aiming to steal sensitive information, financial assets, or disrupt operations. This project seeks to develop a web plugin dashboard to help cybersecurity researchers and managers better understand the scope and impact of scam-related cyberattacks targeting critical infrastructure sectors such as Government Services, InfoComm, Manufacturing, Energy, Transportation, Healthcare, Security and Emergency Services, and Banking and Finance
# Version:     v0.0.1
# Created:     2024/10/01
# Copyright:   Copyright (c) 2024 LiuYuancheng
# License:     MIT License
Introduction
This project aims to develop a dashboard that visualizes large datasets of scam threat events sourced from publicly available cybersecurity datasets. The dashboard will be an essential tool for cybersecurity researchers and managers, allowing them to analyze and understand scam incidents targeting critical infrastructure. By offering real-time visualization, it will help organizations gain insights into attack patterns, trends, and sector-specific vulnerabilities.
The dashboard will feature several key components: an event count timeline panel, a scam event world heatmap, sector-specific line charts displaying various scam threat types, and a pop-up information dialog for in-depth event breakdowns and graphical analysis.
-
Types of Cybersecurity Scams Visualized:
Phishing,Ransomware,Tech Support Scams,Business Email Compromise (BEC),Investment or Charity ScamsandCryptocurrency Scams. -
Critical Infrastructure Sectors Covered:
Government Services,InfoComm (Information and Communication),Manufacturing-related Services,Energy Services (Utilities, Power),Transportation Services,Health and Social Services,Security and Emergency Services,Banking and Finance. -
Visualization Methods Applied:
Heatmapsfor geographical representation of incidents,Bar/Pie Chartsfor comparing scam events by type and sector,Geographic Mapsfor scam event locations,Timeline Graphsfor visualizing trends over time.
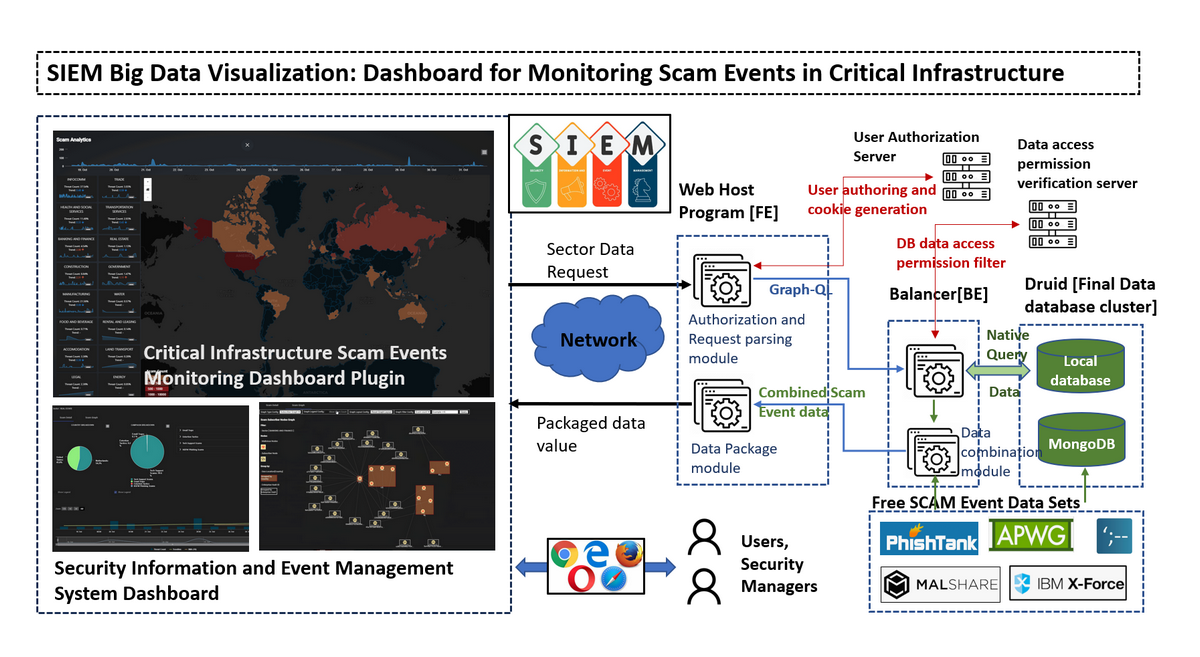
The project is divided into two main sections: Front-End Web Host and Back-End Database Balancer.
-
Front-End: The front-end is powered by an Angular web host that serves the user interface and handles HTTP requests. This allows users to interact with the dashboard, view visualizations, and explore the data.
-
Back-End: The back-end consists of a GraphQL query system that optimizes data retrieval from the database cluster. It efficiently handles multiple user queries by balancing request loads and converting GraphQL queries into native queries, while ensuring user data permissions and access limitations are respected.
This integrated system will provide a powerful and user-friendly platform to monitor and analyze scam threats, helping to enhance cybersecurity strategies and decision-making for critical infrastructure protection.
For the plugin demo, please refer to this video:
Dashboard Main UI View
The plug-in dashboard layout is designed to offer an intuitive and data-driven experience, providing cybersecurity professionals with real-time insights into scam activities and their impact on critical infrastructure. A preview of the Dashboard Webpage is shown below:
Figure-01 Scam event analytics dashboard plugin webpage view, version v0.1 (2024)
The dashboard consists of five key sections, designed to provide a comprehensive view of scam threat data:
-
Total Scam Threats Timeline Chart: Displays the total count of scam events over time, with an adjustable time unit (e.g., daily, weekly, monthly) to allow for flexible time-based analysis.
-
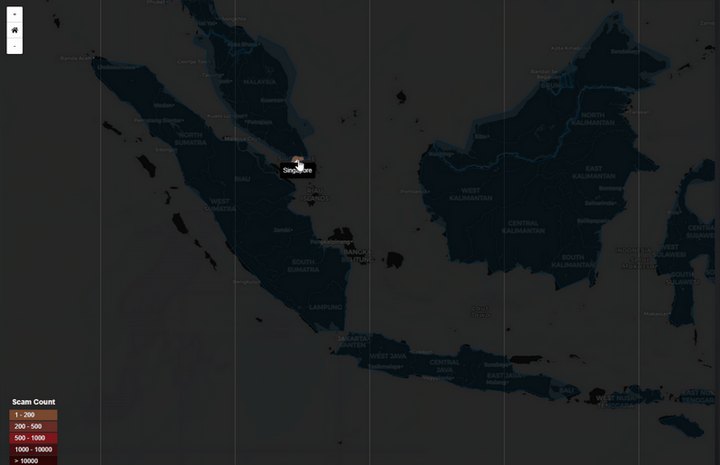
Scam Threats World Heatmap: Visualizes the geographic distribution of scam sources (attackers), categorized by country, showing the intensity of scam activities across different regions.
-
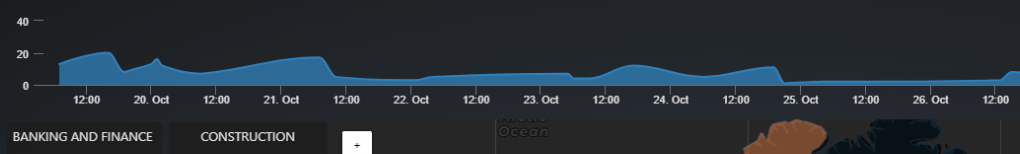
Sector-Specific Scam Timeline Panel: Compares the historical scam activity targeting different critical infrastructure sectors, with a summary overlay that highlights key trends and sector-specific insights.
-
Detailed Breakdown Pop-Up: Provides in-depth analysis of scam events, including country-specific activity, sector targeting, campaign details, and scam types (e.g.,
Email Traps,Extortion Tactics,Tech Support Scams,NSFW Phishing Scams). It also includes a scannable timeline chart showing scam events for the most recent month. -
Scam Source-Destination Relationship Graph
Scam Data Source
To gather scam event data, you can build your own database by utilizing various sources such as Incident Reports, Threat Intelligence Feeds, Security Bulletins, Historical Cyberattack DataUser/Employee Reports of Suspicious Activities, and Industry-Specific Security Audits and Assessments. Additionally, there are several free resources that provide valuable datasets for scam event research, analysis, and visualization:
| Scam Sector Covered | Description | Link | |
|---|---|---|---|
| PhishTank | Banking, Government, and Information Services | A free community-driven site where users submit and track phishing websites. | |
| APWG (Anti-Phishing Working Group) Reports | Banking, Government and geographic distribution | APWG provides free quarterly reports on phishing trends | |
| Have I Been Pwned (HIBP) | information and communication, health | HIBP tracks breaches and scam events related to leaked user data. | |
| Cybercrime Tracker | Energy and Transport | Tracks various types of cybercrime including phishing, ransomware, and command & control servers. | |
| MalShare | Manufacturing, Energy, and Healthcare | A free malware repository providing a large database of malware-related data, including ransomware and phishing kits. | |
| IBM X-Force Exchange | Government, Energy, and Banking | IBM's threat intelligence sharing platform that provides free access to a wide range of cybersecurity threat data. | |
| Spamhaus Project | Information Services and Banking | Spamhaus provides data on spam and phishing sources across the internet. | |
| CIRCL MISP (Malware Information Sharing Platform) | Energy or Transportation | An open-source threat intelligence platform that aggregates and shares scam event data. | |
| OpenPhish | Banking and Government | A threat intelligence platform focused on phishing, offering both free and premium feeds. | |
| CISA (Cybersecurity & Infrastructure Security Agency) | Energy, Transportation, and Government Services | The US government’s cybersecurity agency regularly publishes reports, alerts, and advisories on threats, including scams targeting critical infrastructure. | |
| Ransomwhere | Manufacturing, Energy, and Healthcare. | A crowdsourced ransomware payment tracking site. |
These data sources provide a solid foundation for scam event tracking and analysis, enabling organizations to better monitor and understand cyber threats across critical infrastructure sectors.
The system is designed as an Angular plugin, programmed using TypeScript, with a back-end database balancer implemented in GraphQL and JavaScript. The back-end uses a Druid database cluster to manage and process data, alongside a data fetch module that integrates with various APIs to continuously pull scam event data from different sources. The system is flexible, allowing users to modify the data-fetching process and incorporate data from multiple sources.
The dashboard data visualization workflow is as follows:
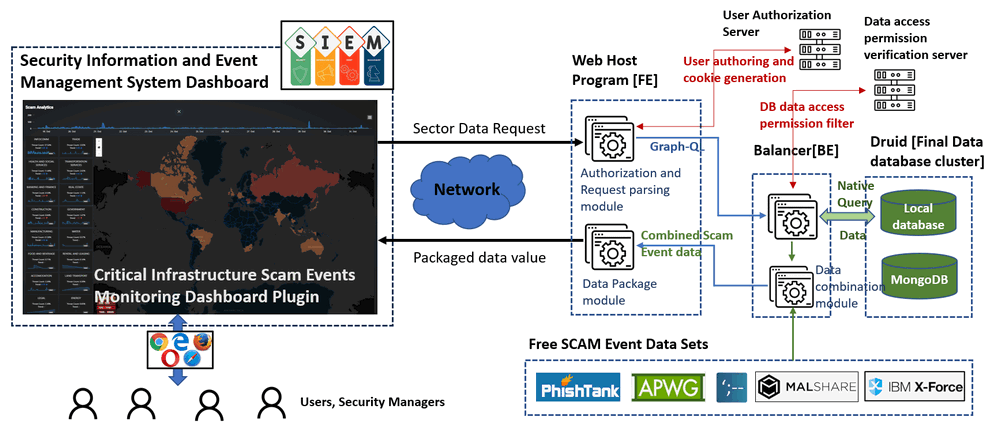
Figure-02 System workflow diagram, version v0.1 (2024)
The dashboard contents 3 main parts: Main Scam Analytics Dashboard, Scam Event Breakdown Information Pop-Up Window and Scam Source-Destination Relationship Graph display.
Main Scam Analytics Dashboard
The Main Scam Analytics Dashboard provides an overview of scam events across various critical infrastructure sectors. The interface contains several key elements:
-
A timeline chart
-
16 small trend charts to show the scam activity across different critical infrastructure sectors, includes:
1.Infocomm,2.Trade,3.Health and Social Services,4.Transportation Services,5.Banking and Finance,6.Real Estate,7.Construction,8.Government,9.Manufacturing,10.Water,11.Food and Beverage,12.Rental and Leasing,13.Accommodation,14.Land Transport,15.Legaland16.Energy -
A Geographic Heatmap to visualize the distribution of scam events across various countries.
The Main Scam Analytics Dashboard is shown below:
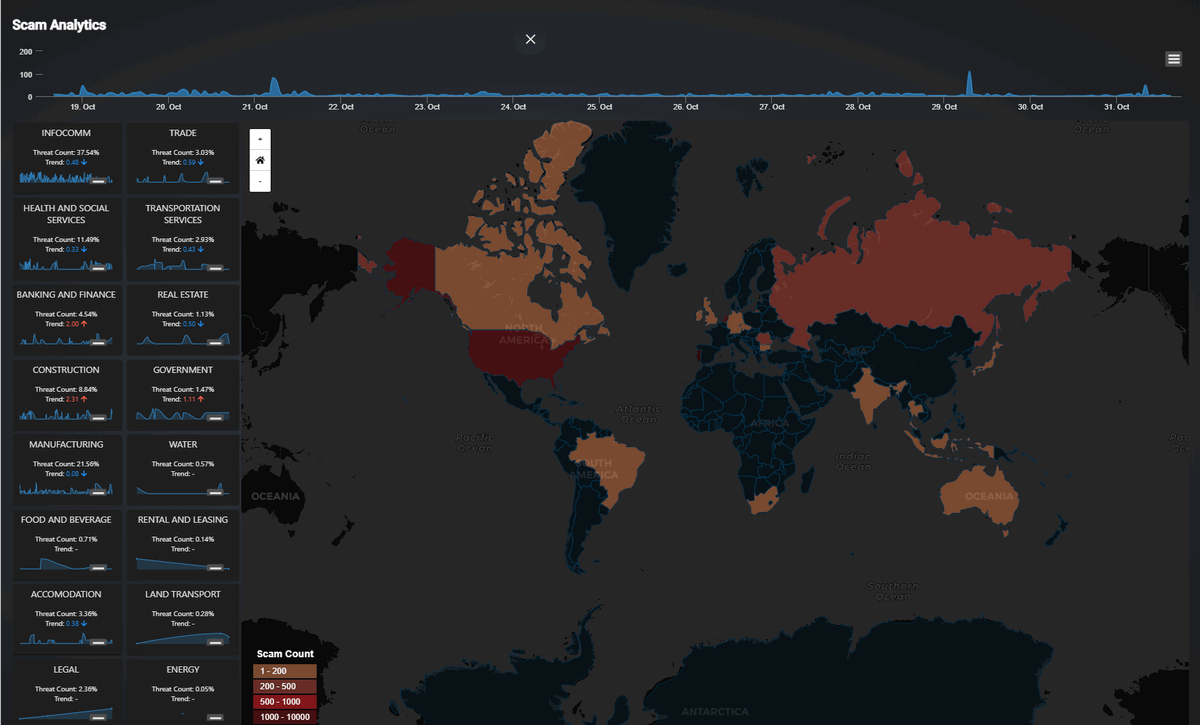
Figure-03 Main Scam Event Analytics Dashboard Screenshot, version v0.1 (2024)
Scam Event Breakdown Information Pop-Up Window
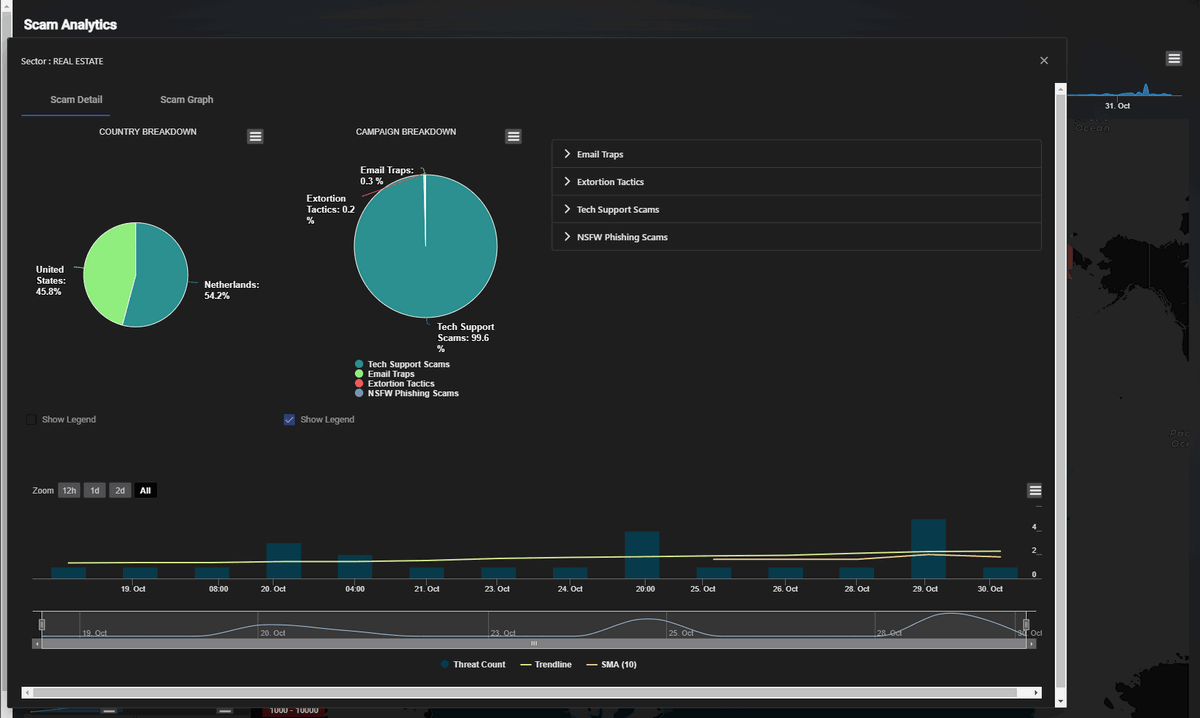
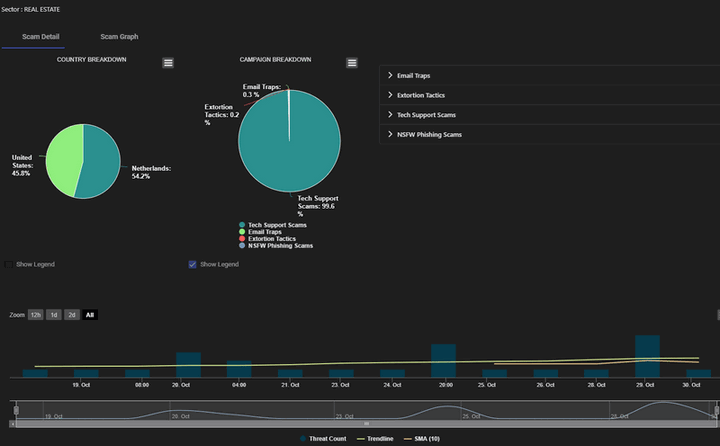
The breakdown includes four types of information for the selected sector:
-
A pie chart showing the geographic distribution of scams by country, indicating the percentage of scams occurring in each region.
-
A pie chart breaking down the different categories of scams within the sector, such as
Email Traps,Extortion Tactics, andNSFW Phishing Scams. -
A grid table providing detailed descriptions of each scam category within the sector.
-
A bar chart displaying the monthly trend of scam events.
The Scam Source-Destination Relationship Graph provides a visual representation of the connections between scam event sources and their respective targets. Built using Cytoscape, this graph displays the flow of scam events between entities, highlighting the number of events and the type of scams involved.
The panel also includes a filter function, allowing users to customize the graph based on the number of scam threat events or other criteria. The graph is illustrated below:
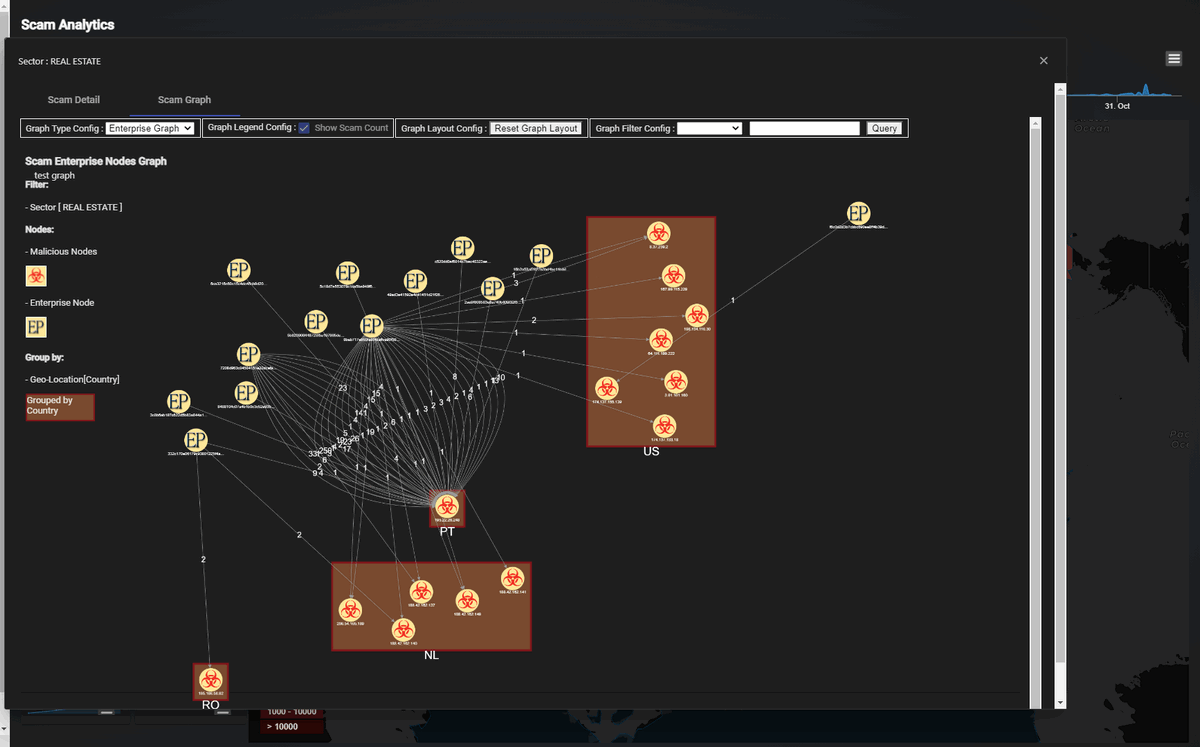
This relationship graph helps users analyze the source and target sectors, scam types, and event volumes to gain deeper insights into scam activities affecting critical infrastructure sectors.
Back-End Data Query Design
The back-end query design leverages Druid for efficient data retrieval and processing of scam events. These queries are used to fetch, group, and filter data, providing actionable insights for visualization in the dashboard. Below are the key query designs for country code lookups, campaign breakdowns, and sector graphs.
1. Country Code Lookup Query
To ensure accurate geographic representation of scam events, we perform a country code lookup for all IP addresses. This helps categorize threats based on their origin and provides data for geographic heatmaps.
1.1 Query to retrieve IP country codes: This query finds all destination node IDs along with their respective country codes from the dataset:
SELECT dstNodeId, dstCountry
FROM "ds-findings-scam-url-ioc-2019"
GROUP BY dstNodeId, dstCountry
1.2 Query using country code lookup: This query filters results by a specific country (e.g., Singapore, "SG") and groups by the originating sector (srcSector). It counts the number of threats per sector, allowing us to see which sectors are being targeted:
SELECT srcSector, count(*) AS threatCount
FROM "ds-findings-scams-matched-results"
WHERE lookup(dstNodeId, 'lookup-ip-country') = 'SG'
GROUP BY srcSector
2. Campaign Breakdown Query
To track the volume and timing of scam events, we can break down threat activity by time intervals, providing data for time-series visualizations such as timelines or trend charts.
2.1 Hourly campaign breakdown: This query groups the data by hourly time intervals and counts the number of scam threats detected per hour, filtered by the country code:
SELECT DATE_TRUNC('hour', __time), count(*) AS threatCount
FROM "ds-findings-scams-matched-results"
WHERE lookup(dstNodeId, 'lookup-ip-country') = 'SG'
GROUP BY DATE_TRUNC('hour', __time)
3. Sector Graph Data Queries
These queries help build the source-destination relationship graph for scam events. They provide a detailed view of how scams propagate between source enterprises and destination nodes, grouped by sector and country.
3.1 Query to create edges for sector graph: This query retrieves connections between the source (srcEnterpriseId) and destination nodes (dstNodeId), grouping by sectors such as "INFOCOMM" and filtering by country:
SELECT dstNodeId, srcEnterpriseId, srcNodeId, lookup(dstNodeId, 'lookup-ip-country')
FROM "ds-findings-scams-matched-results"
WHERE srcSector = 'INFOCOMM'
GROUP BY dstNodeId, srcEnterpriseId, srcNodeId, lookup(dstNodeId, 'lookup-ip-country')
3.2 Query to create nodes for scam graph with country information: This query generates nodes for the scam event graph, showing the relationship between the source (srcEnterpriseId), destination node, and the respective country. It also provides a threat count for each connection:
SELECT dstNodeId, srcEnterpriseId, srcNodeId, lookup(dstNodeId, 'lookup-ip-country'), count(*) AS threatCount
FROM "ds-findings-scams-matched-results"
WHERE lookup(dstNodeId, 'lookup-ip-country') = 'SG'
GROUP BY dstNodeId, srcEnterpriseId, srcNodeId
These optimized queries ensure efficient data retrieval and processing for scam event visualization, supporting the front-end dashboard with actionable and interactive insights into threat activity across critical infrastructure sectors.
This design defines five key component panels used to create the dashboard webpage, providing users with a detailed and interactive way to visualize scam threats across various critical infrastructure sectors. Below are the descriptions of each component panel and its functionality.
1. Scam Threat Events Timeline Chart Panel
This panel displays the total number of scam threats over time, allowing users to observe trends and patterns. Events are sorted chronologically by timestamp (e.g., daily or hourly), providing a clear view of when scam activities spike or decrease. This timeline chart is especially useful for tracking the frequency of scam threats over a specific period.
2. Event Source Heatmap
World Heatmap visually represents the geographical origins of scam threats by mapping the scam event count based on attacker locations. Each country is color-coded based on the intensity of scam activity originating from that region. This heatmap helps identify regions with high scam activity, allowing analysts to focus on specific threat sources globally.
This panel shows scam events targeting various sectors over time. Each sector’s historical data is displayed as a timeline chart, with an overlay of comparison summary results to visualize how different sectors are being impacted by scams. Users can compare scam activity across multiple sectors simultaneously, providing insights into sector-specific vulnerability trends.
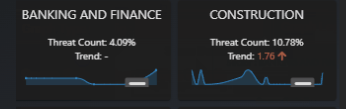
Figure-08 Scam Destination Sector History Timeline Chart Panel Screenshot, version v0.1 (2024)
When users click on a sector chart, a detailed breakdown dialog window appears. This pop-up displays:
-
Country breakdown showing which regions are involved in scam events within the selected sector.
-
Campaign breakdown providing details about specific scam campaigns.
-
Scam type breakdown showing categories like Email Traps, Extortion Tactics, Tech Support Scams, and NSFW Phishing Scams.
-
A scannable timeline chart of scam threats over the last month, enabling users to explore more recent trends in greater depth.
This pop-up allows for a deeper analysis of individual scam events and their characteristics.
5. Scam Source-Destination Relationship Graph
This displays the relationships between scam sources and their targets. The graph visualizes how scam events propagate between various entities, such as enterprises or subscribers, and shows the flow of threats between source and destination nodes. It also includes a filter function that enables users to rebuild the graph based on scam event counts, making it easier to focus on high-priority events or regions.
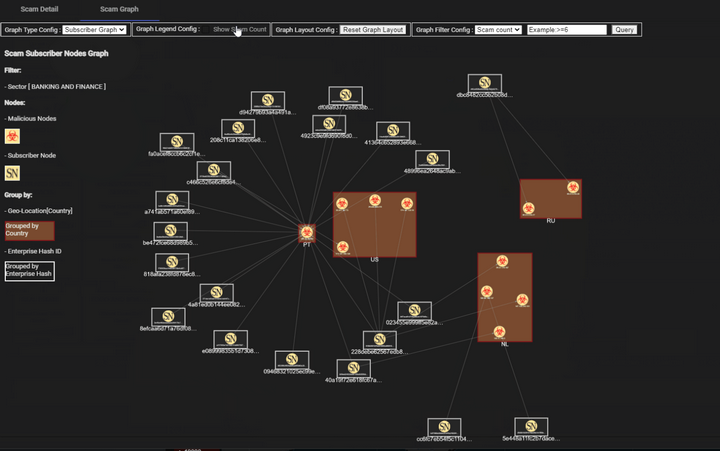
Figure-10 Scam Source-Destination Relationship Graph Screenshot, version v0.1 (2024)
These components provide a comprehensive set of tools for scam event visualization, enabling cybersecurity professionals to explore the data from different perspectives—whether it's by time, geography, or sector-specific trends. The interactive design makes it easy to drill down into detailed scam event data for a more informed analysis.
This section outlines the program file structure, environment setup, and steps for executing the Scam Event Dashboard. Follow these instructions to correctly configure and run the system.
Copy the file to your angular project:
| Program File/Folder | Execution Environment | Description |
|---|---|---|
src/sectorial/data/*.json |
JSON | Country code matching JSON file used for geographical data lookup. |
src/sectorial/scam/* |
TypeScript | Main program for building the webpage frame. |
src/sectorial/scam-sector/card/* |
TypeScript | Component that displays each sector's historical timeline chart in card format. |
src/dash-sector-details/* |
TypeScript | Component for the pop-up dialog displaying the detailed breakdown and source-destination relationship graph. |
backEnd/threatEvents/resolvers/*.js |
JavaScript | Backend resolver modules used for querying and balancing the data fetch process. |
backEnd/threatEvents/schema/*.gql |
GraphQL (gql) | GraphQL schema and datatype definition files for handling scam event data queries. |
Program Usage/Execution
Copy Files to Appropriate Directories
-
Frontend (UI) Files: Copy the
srcfolder into your project atProject\src\app\pages. -
Backend (GraphQL): Copy the
threatEventsfolder into your backend’sgraphqlfolder. -
Routing Configuration: Import the
graph-scam-componentinto your project's routing module by modifyingapp-routing.module.ts. -
Command to Run the Program: To start the development server and compile the project, use the following command
npm run dev
Access the Webpage: you can directly access the dashboard at: http://localhost:4200/#/scam
Reference
-
Angular High-chart word cloud: https://medium.com/@pmzubar/creating-awesome-word-clouds-using-highcarts-js-76967cb15c22
-
Angular tool-tip: https://material.angular.io/components/tooltip/overview
-
Angular Geo Map: https://leafletjs.com/
-
Angular Grid: https://www.jqwidgets.com/jquery-widgets-demo/demos/jqxgrid/index.htm
last edit by LiuYuancheng (liu_yuan_cheng@hotmail.com

