Most of the time, when we develop software or even use software, we play within the safe boundaries of the operating system. We might not know how the network interface welcomes that IP packet, nor how the filesystem handles the inodes when we save a file.
This boundary is called user space, which is where we write applications, libraries, and tools. But there's another world, kernel space, where the operating system's kernel resides and is responsible for managing system resources such as memory, CPU, and I/O devices.
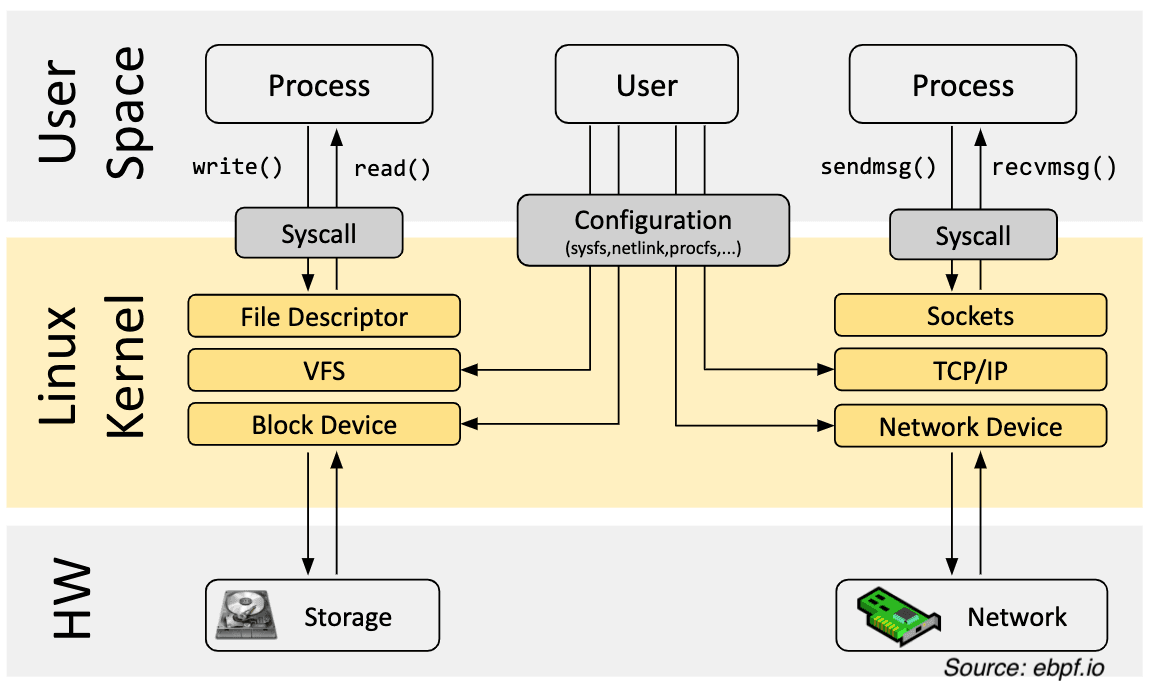
We usually don’t need to go below the socket or file descriptor level, but sometimes we do. Suppose you want to analyze an application to see how many resources it consumes.
If you analyze the application from user space, you will not only miss out on a lot of useful details but also consume considerable resources just for the analysis itself, because every layer above the CPU or memory introduces some overhead.
To Go Deeper
Suppose you want to delve deeper into the stack and somehow inject custom code into the kernel to analyze an application, trace system calls, or monitor network packets. What would you do?
Traditionally, you have two options.
Option 1: Edit Kernel Source Code
If you want to change the Linux kernel source code and then send the same kernel to your customer's machines, you need to convince the Linux kernel community that the change is necessary. Then, you will have to wait years for the new kernel version to be adopted by Linux distributions.
For most cases, this is not a practical method and is somewhat impractical.
Just for analyzing an application or monitoring network packets.
Option 2: Write a Kernel Module
You can write a kernel module, which is a piece of code that can be loaded into the kernel and executed. This is a more practical approach, but it also comes with its own risks and drawbacks.
First, you need to write a kernel module, which is not an easy task. Then, you need to maintain it regularly because the kernel is a living thing that changes over time. If you do not maintain the kernel module, it will become obsolete and won't work with new kernel versions.
Secondly, you risk breaking the Linux kernel because kernel modules do not have safety boundaries. If the kernel module you wrote contains errors, it might cause the entire system to crash.
Choosing eBPF
eBPF (extended Berkeley Packet Filter) is a revolutionary technology that allows you to reprogram the Linux kernel within minutes, without needing to restart the system.
eBPF allows you to trace system calls, user-space functions, library functions, network packets, and much more. It is a powerful tool for system performance, monitoring, security, and more.
How to Use It
eBPF is a system consisting of multiple components:
- eBPF programs
- eBPF hooks
- BPF maps
- eBPF verifier
- eBPF virtual machine
Note that I interchangeably use the terms "BPF" and "eBPF". eBPF stands for "extended Berkeley Packet Filter". BPF was initially introduced into Linux to filter network packets, but eBPF extended the original BPF to be used for other purposes. Today it is unrelated to Berkeley and is used for much more than just packet filtering.
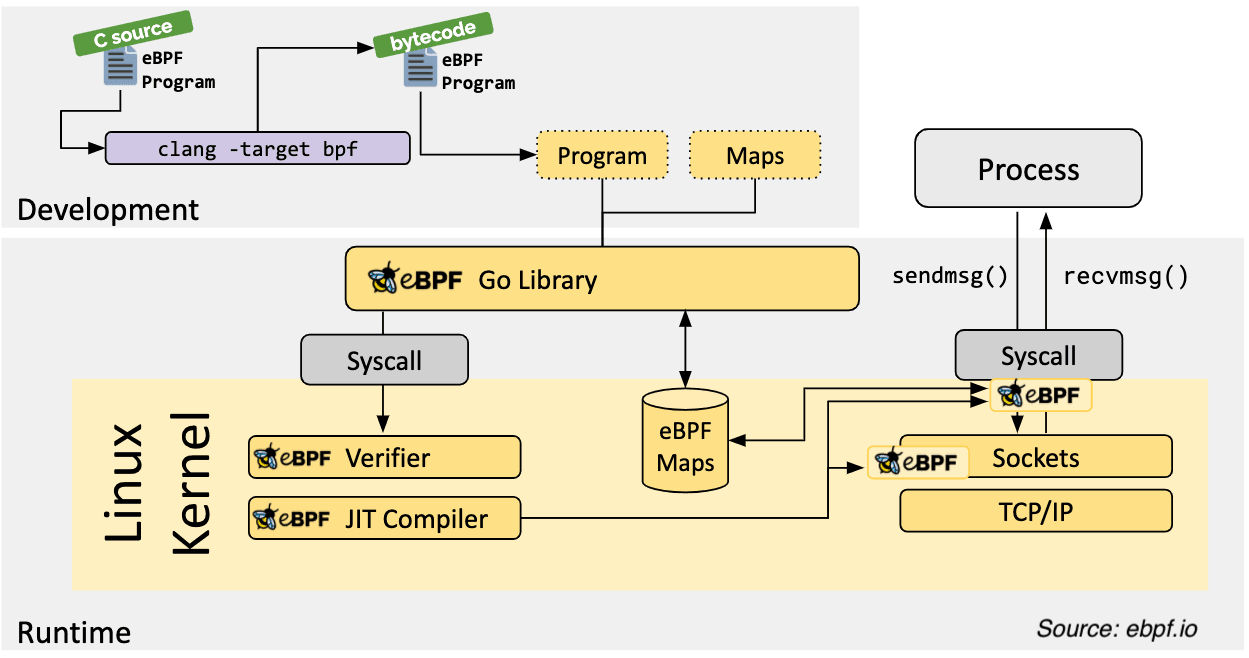
Below is an illustration of how eBPF works in user space and underneath. eBPF programs are written in high-level languages such as C and then compiled into eBPF bytecode. The eBPF bytecode is then loaded into the kernel and executed by the eBPF virtual machine.
eBPF programs are attached to specific code paths within the kernel, such as system calls. These code paths are referred to as hooks. When a hook is triggered, the eBPF program is executed, and now it performs the custom logic you wrote. This way, we can run our custom code in kernel space.
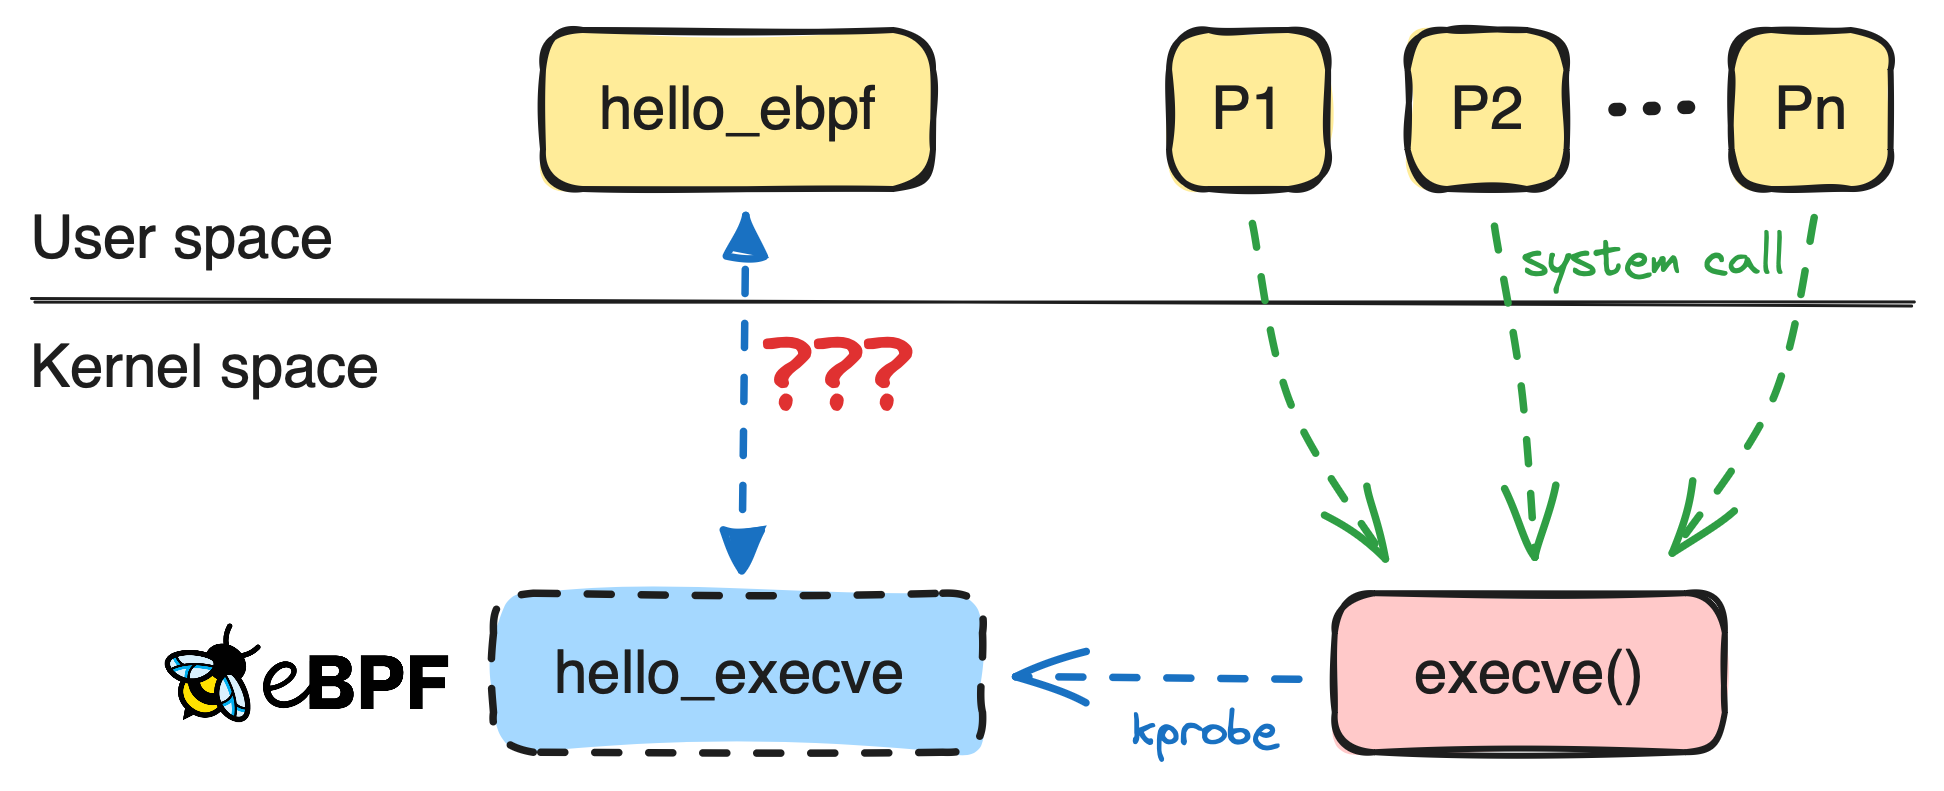
eBPF Hello World
Before diving into the details, let's write a simple eBPF program to trace the `execve` system call. We'll write the program in C, the userspace program in Go, and then run the userspace program to load the eBPF program into the kernel and poll for custom events emitted by the eBPF program before the `<b1>` system call is actually executed.
Writing the eBPF Program
Let's start by writing the eBPF program. I'll write it piece by piece to better explain the details, but you can find the entire program in my GitHub repository.
// hello_ebpf.c
1#include "vmlinux.h"
#include <bpf/bpf_helpers.h>

struct event {
    u32 pid;
    u8  comm[100];
};

struct {
    __uint(type, BPF_MAP_TYPE_RINGBUF);
    __uint(max_entries, 1000);
} events SEC(".maps");
Here, we import the vmlinux.h header file, which includes the kernel's data structures and function prototypes. Then we include the bpf_helpers.h header file, which contains helper functions for eBPF programs.
Next, we define a struct to hold the event data, and then define a BPF map to store the events. We will use this map to pass events between the eBPF program running in kernel space and the userspace program.
We will detail BPF maps later, so if you don't understand why we use BPF_MAP_TYPE_RINGBUF or the purpose of SEC(".maps"), don't worry.
Now we are ready to write our first program and define the hook it will attach to:
//   hello_ebpf.c
SEC("kprobe/sys_execve")
int hello_execve(struct pt_regs *ctx) {
    u64 id = bpf_get_current_pid_tgid();
    pid_t pid = id >> 32;
    pid_t tid = (u32)id;

    if (pid != tid)
        return 0;

    struct event *e;

    e = bpf_ringbuf_reserve(&events, sizeof(struct event), 0);
    if (!e) {
        return 0;
    }

    e->pid = pid;
    bpf_get_current_comm(&e->comm, 100);

    bpf_ringbuf_submit(e, 0);

    return 0;
}
Here we define a function hello_execve and use the kprobe hook to attach it to the sys_execve system call. A kprobe is one of the many hooks provided by eBPF used for tracing kernel functions. This hook will trigger our hello_execve function before the sys_execve system call executes.
In the hello_execve function, we first get the process ID and thread ID, then check if they are the same. If they are not the same, it means we are in a thread, and we don't want to trace threads, so we exit the eBPF program by returning zero.
Then we reserve space in the events map to store the event data, fill the event data with the process ID and the command name of the process, and submit the event to the `events` map.
So far, so good, right?
Writing the Userspace Program
Before starting to write the userspace program, let me briefly explain what the program needs to do in userspace. We need a userspace program to load the eBPF program into the kernel, create the BPF Map, attach to the BPF Map, and read events from the BPF Map.
To perform these actions, we need to use a specific system call. This system call is called bpf(), and it is used to perform operations related to eBPF, such as reading the contents of a BPF Map.
We can call this system call ourselves from userspace, but this involves too many low-level operations. Thankfully, there are libraries that provide a higher-level interface to the bpf() system call. One such library is the ebpf-go package from Cilium, which we will use in this example.
Let's dive into some Go code.
// main.go
//go:generate go run github.com/cilium/ebpf/cmd/bpf2go -type event ebpf hello_ebpf.c

func main() {
    stopper := make(chan os.Signal, 1)
    signal.Notify(stopper, os.Interrupt, syscall.SIGTERM)

    // Allow the current process to lock memory for eBPF resources.
    if err := rlimit.RemoveMemlock(); err != nil {
        log.Fatal(err)
    }

    objs := ebpfObjects{}
    if err := loadEbpfObjects(&objs, nil); err != nil {
        log.Fatalf("loading objects: %v", err)
    }
    defer objs.Close()

    kp, err := link.Kprobe(kprobeFunc, objs.HelloExecve, nil)
    if err != nil {
        log.Fatalf("opening kprobe: %s", err)
    }
    defer kp.Close()

    rd, err := ringbuf.NewReader(objs.Events)
    if err != nil {
        log.Fatalf("opening ringbuf reader: %s", err)
    }
    defer rd.Close()
// ...
The first line is a Go compiler directive go:generate. Here, we tell the Go compiler to run the bpf2go tool from the github.com/cilium/ebpf/cmd/bpf2go package, and generate a Go file from the hello_ebpf.c file.
The generated Go file will include the Go representation of the eBPF program, types, and structures defined in the eBPF program. We will use these representations in our Go code to load the eBPF program into the kernel and interact with the BPF map.
Then we use the generated types to load the eBPF program (loadEbpfObjects), attach to the kprobe hook (link.Kprobe), and read events from the BPF Map (ringbuf.NewReader). All these functions use the generated types.
It's time to interact with the kernel side:
//    main.go
//    ...
    go func() {
        <-stopper

        if err := rd.Close(); err != nil {
            log.Fatalf("closing ringbuf reader: %s", err)
        }
    }()

    log.Println("Waiting for events..")

    var event ebpfEvent
    for {
        record, err := rd.Read()
        if err != nil {
            if errors.Is(err, ringbuf.ErrClosed) {
                log.Println("Received signal, exiting..")
                return
            }
            log.Printf("reading from reader: %s", err)
            continue
        }

        if err := binary.Read(bytes.NewBuffer(record.RawSample), binary.LittleEndian, &event); err != nil {
            log.Printf("parsing ringbuf event: %s", err)
            continue
        }

        procName := unix.ByteSliceToString(event.Comm[:])
        log.Printf("pid: %d\tcomm: %s\n", event.Pid, procName)
    }
}
We spawn a goroutine to listen on the stopper channel, which is defined earlier in the Go code snippet. When we receive an interrupt signal, this channel will be used to gracefully stop the program.
Then we start a loop to read events from the BPF Map. We use the ringbuf.Reader type to read events and then parse the event data into the ebpfEvent type using the binary.Read function.
Finally, we print the process ID and the command name of the process to standard output.
Running the Program
Now that we have prepared the program, we are ready to run it. First, we need to compile the eBPF program, and then run the userspace program.
$ go generate
Compiled /Users/sazak/workspace/gocode/src/github.com/ozansz/intro-ebpf-with-go/0x01-helloworld/ebpf_bpfel.o
Stripped /Users/sazak/workspace/gocode/src/github.com/ozansz/intro-ebpf-with-go/0x01-helloworld/ebpf_bpfel.o
Wrote /Users/sazak/workspace/gocode/src/github.com/ozansz/intro-ebpf-with-go/0x01-helloworld/ebpf_bpfel.go
Compiled /Users/sazak/workspace/gocode/src/github.com/ozansz/intro-ebpf-with-go/0x01-helloworld/ebpf_bpfeb.o
Stripped /Users/sazak/workspace/gocode/src/github.com/ozansz/intro-ebpf-with-go/0x01-helloworld/ebpf_bpfeb.o
Wrote /Users/sazak/workspace/gocode/src/github.com/ozansz/intro-ebpf-with-go/0x01-helloworld/ebpf_bpfeb.go

$ go build -o hello_ebpf
We first run the go generate command to compile the eBPF program, and then the go build command to compile the userspace program.
Afterwards, we run the userspace program:
sudo ./hello_ebpf
hello_ebpf: 01:20:54 Waiting for events..
I ran this program inside a Lima VM. Why don't you open another shell and see what happens?
sudo ./hello_ebpf
hello_ebpf: 01:20:54 Waiting for events..
Meanwhile, in the first shell:
hello_ebpf: 01:22:22 pid: 3360  comm: sshd
hello_ebpf: 01:22:22 pid: 3360  comm: bash
hello_ebpf: 01:22:22 pid: 3361  comm: bash
hello_ebpf: 01:22:22 pid: 3362  comm: bash
hello_ebpf: 01:22:22 pid: 3363  comm: bash
hello_ebpf: 01:22:22 pid: 3366  comm: bash
hello_ebpf: 01:22:22 pid: 3367  comm: lesspipe
hello_ebpf: 01:22:22 pid: 3369  comm: lesspipe
hello_ebpf: 01:22:22 pid: 3370  comm: bash
As expected, we see the sshd process launching, followed by bash processes, and then lesspipe processes, and so on.
This is a simple example illustrating how we can use eBPF to trace the execve system call and then read events from a BPF Map in userspace. We wrote a fairly simple yet powerful program that intercepted the execve system call without modifying the kernel source code or restarting the system.
eBPF Hooks and Maps
So, what actually happened in the previous example? We used the kprobe hook to attach our eBPF program to the sys_execve system call so that the hello_execve function would run when the sys_execve system call executes before the original system call code is invoked.
eBPF is event-driven, meaning it expects us to attach our eBPF programs to specific code paths in the kernel. These code paths are called "hooks," and eBPF offers various types of hooks. The most common ones are:
kprobe,kretprobe: Tracing kernel functionsuprobe,uretprobe: Tracing userspace functionstracepoint: Tracing predefined trace points in the kernelxdp: eXpress Data Path, used for filtering and redirecting network packetsusdt: User Static Defined Tracing, used for tracing userspace functions in a more efficient manner
kprobe and uprobe are used to call the attached eBPF program before the function/system call execution, while kretprobe and uretprobe are used to call the attached eBPF program after the function/system call execution.
We also used a BPF Map to store the events. BPF Maps are data structures used for storing and communicating different types of data. They are also used for state management. There are too many supported BPF Map types to list, and we use different types of maps for different purposes. Some of the most common BPF Map types are:
- BPF_MAP_TYPE_HASH: Hash table
- BPF_MAP_TYPE_ARRAY: Array
- BPF_MAP_TYPE_RINGBUF: Ring buffer
- BPF_MAP_TYPE_STACK: Stack
- BPF_MAP_TYPE_QUEUE: Queue
- BPF_MAP_TYPE_LRU_HASH: Least Recently Used (LRU) hash map
Some of these map types also have per-CPU variants, such as BPF_MAP_TYPE_PERCPU_HASH, which is a hash map with a separate hash table for each CPU core.
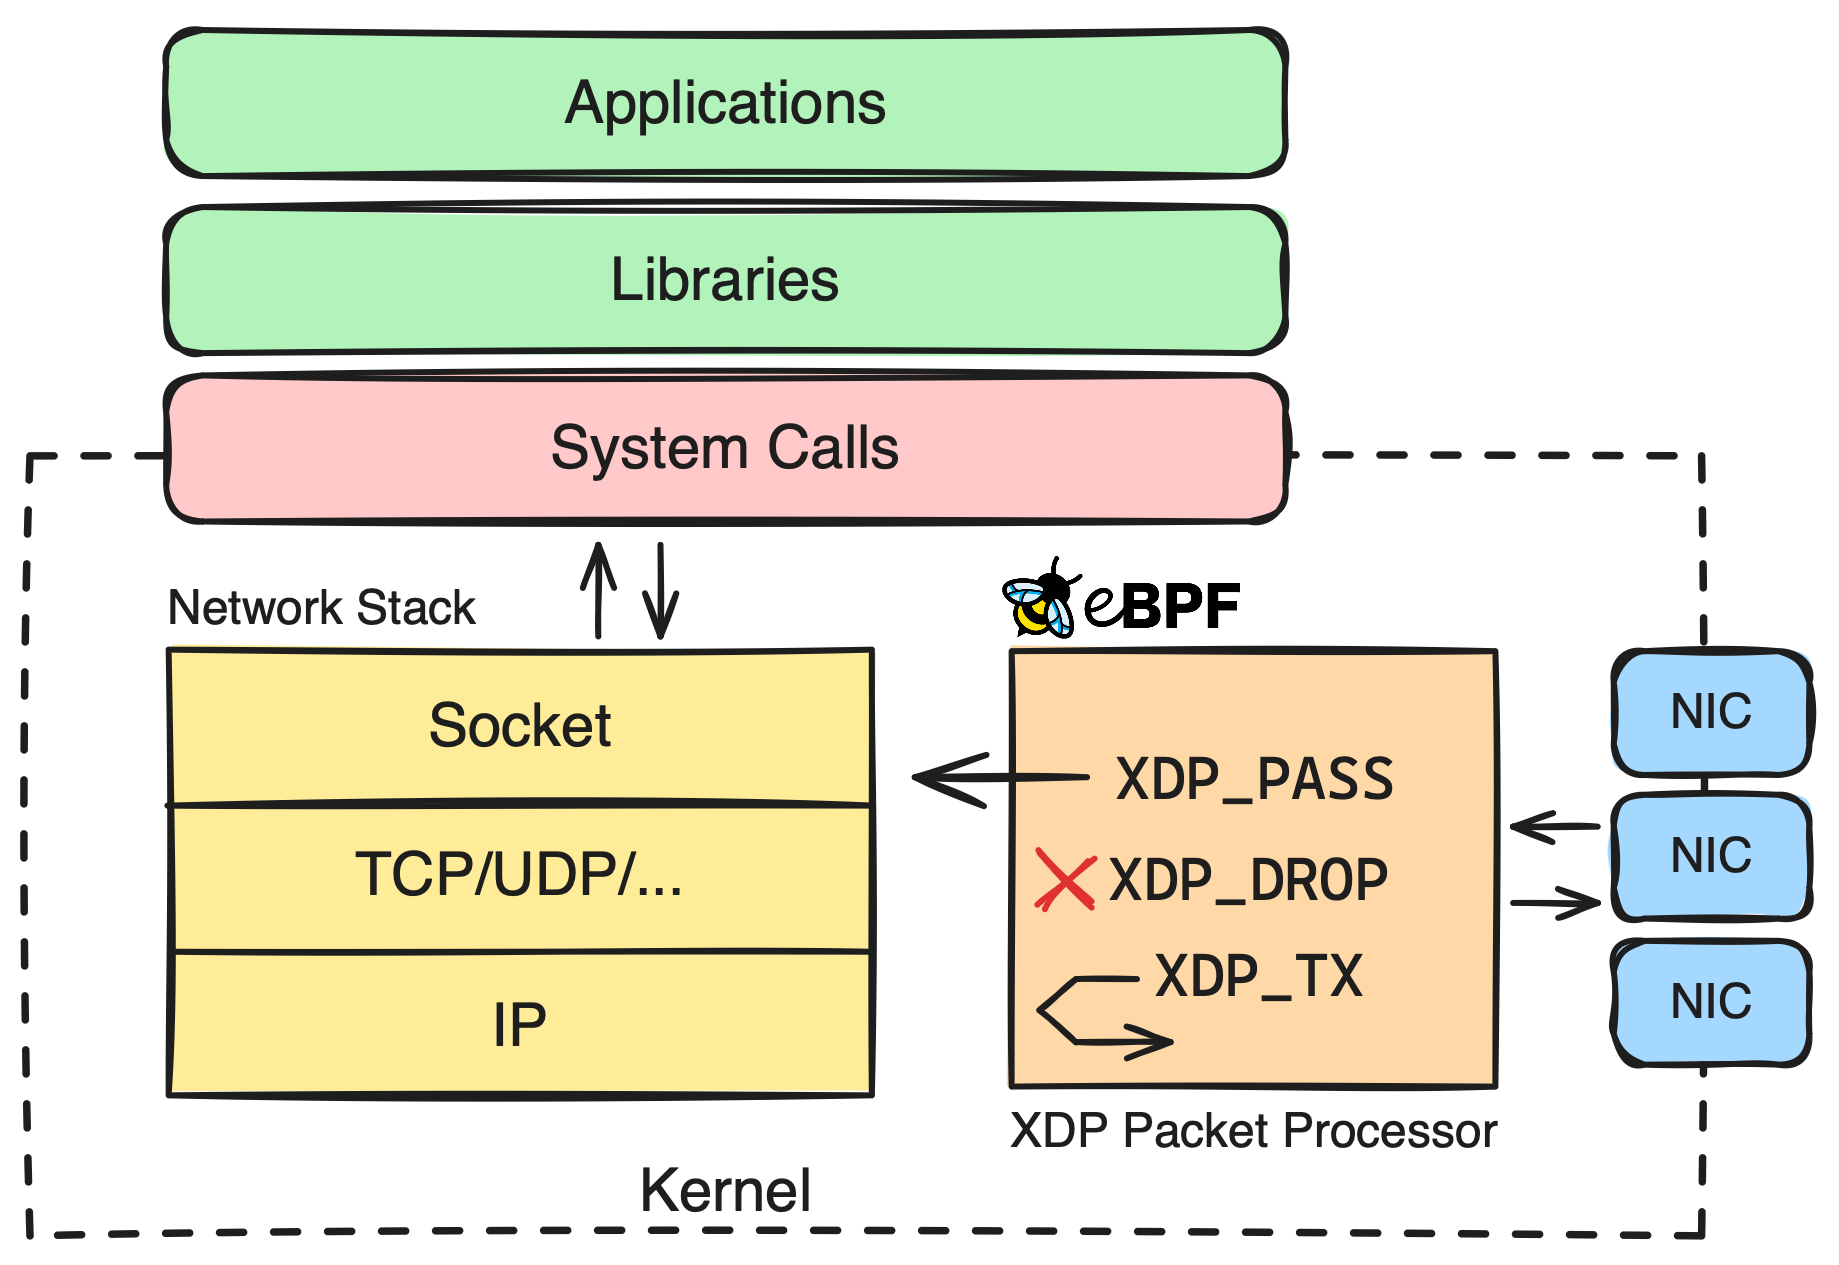
Going Further: Tracing Incoming IP Packets
Let's take it a step further and write a more complex eBPF program. This time, we will use an XDP (eXpress Data Path) hook to call an eBPF program after the network interface sends network packets to the kernel but before the kernel processes the packet.
Writing the eBPF Program
We will write an eBPF program that counts incoming IP packets based on their source IP address and port number, and then read the counts from a BPF Map in userspace. We will parse the Ethernet, IP, and TCP/UDP headers of each packet and store the count of valid TCP/UDP packets in the BPF Map.
1. The eBPF Program:
// hello_ebpf.c
#include "vmlinux.h"
#include <bpf/bpf_helpers.h>
#include <bpf/bpf_endian.h>

#define MAX_MAP_ENTRIES 100

/* Define an LRU hash map for storing packet count by source IP and port */
struct {
    __uint(type, BPF_MAP_TYPE_LRU_HASH);
    __uint(max_entries, MAX_MAP_ENTRIES);
    __type(key, u64); // source IPv4 addresses and port tuple
    __type(value, u32); // packet count
} xdp_stats_map SEC(".maps");
Just like in the first example, we include vmlinux.h and the BPF helper headers. We also define a map xdp_stats_map to store IP:ports and packet count information. We will populate this map within the hook function and read it in the userspace program.
By IP:ports, I mean a u64 value containing the source IP, source port, and destination port. An IP address (specifically IPv4) is 32 bits long, and each port number is 16 bits long, so we need 64 bits to store all three—this is why we use u64 here. Since we are only dealing with ingress (incoming packets), we don't need to store the destination IP address.
Unlike the previous example, we now use BPF_MAP_TYPE_LRU_HASH as the map type. This type of map allows us to store (key, value) pairs as a hash map with an LRU variant.
Looking at how we define the map here, we explicitly set the maximum number of entries as well as the types of the map key and value. For the key, we use a 64-bit unsigned integer, and for the value, we use a 32-bit unsigned integer.
The maximum value of a
u32is (2^{32} - 1), which is sufficient for this example.
To understand the IP address and port numbers, we first need to parse the packet and read the Ethernet, IP, and TCP/UDP headers.
Because XDP is placed after the network interface card, we receive raw packet data in bytes. Therefore, we need to manually traverse the byte array and unpack the Ethernet, IP, and TCP/UDP headers.
We hope to have the header files (vmlinux.h, struct iphdr, struct tcphdr, and struct udphdr). We will use these structures to extract IP address and port number information in a separate function called parse_ip_packet:
// hello_ebpf.c
#define ETH_P_IP        0x0800  /* Internet Protocol packet */
#define PARSE_SKIP          0
#define PARSED_TCP_PACKET   1
#define PARSED_UDP_PACKET   2

static __always_inline int parse_ip_packet(struct xdp_md *ctx, u64 *ip_metadata) {
    void *data_end = (void *)(long)ctx->data_end;
    void *data     = (void *)(long)ctx->data;

    // First, parse the ethernet header.
    struct ethhdr *eth = data;
    if ((void *)(eth + 1) > data_end) {
        return PARSE_SKIP;
    }

    if (eth->h_proto != bpf_htons(ETH_P_IP)) {
        // The protocol is not IPv4, so we can't parse an IPv4 source address.
        return PARSE_SKIP;
    }

    // Then parse the IP header.
    struct iphdr *ip = (void *)(eth + 1);
    if ((void *)(ip + 1) > data_end) {
        return PARSE_SKIP;
    }

    u16 src_port, dest_port;
    int retval;

    if (ip->protocol == IPPROTO_TCP) {
        struct tcphdr *tcp = (void*)ip + sizeof(*ip);
        if ((void*)(tcp+1) > data_end) {
            return PARSE_SKIP;
        }
        src_port = bpf_ntohs(tcp->source);
        dest_port = bpf_ntohs(tcp->dest);
        retval = PARSED_TCP_PACKET;
    } else if (ip->protocol == IPPROTO_UDP) {
        struct udphdr *udp = (void*)ip + sizeof(*ip);
        if ((void*)(udp+1) > data_end) {
            return PARSE_SKIP;
        }
        src_port = bpf_ntohs(udp->source);
        dest_port = bpf_ntohs(udp->dest);
        retval = PARSED_UDP_PACKET;
    } else {
        // The protocol is not TCP or UDP, so we can't parse a source port.
        return PARSE_SKIP;
    }

    // Return the (source IP, destination IP) tuple in network byte order.
    // |<-- Source IP: 32 bits -->|<-- Source Port: 16 bits --><-- Dest Port: 16 bits -->|
    *ip_metadata = ((u64)(ip->saddr) << 32) | ((u64)src_port << 16) | (u64)dest_port;
    return retval;
}- The function checks whether the packet has valid Ethernet, IP, and TCP/UDP headers. These checks are performed using
struct ethhdr'sh_protoandstruct iphdr'sprotocol. Each header stores the protocol of the inner packet it wraps. - It extracts the IP address from the IP header and the port number from the TCP/UDP header, forming an IP:ports tuple in a 64-bit unsigned integer (
u64). - It returns a code to inform the caller whether the packet is a TCP packet, a UDP packet, or something else (
PARSE_SKIP).
Note the __always_inline at the beginning of the function signature. This tells the compiler to always inline this function as static code, saving us from performing a function call.
Now it's time to write the hook function and use parse_ip_packet:
//    hello_ebpf.c
SEC("xdp")
int xdp_prog_func(struct xdp_md *ctx) {
    u64 ip_meta;
    int retval = parse_ip_packet(ctx, &ip_meta);

    if (retval != PARSED_TCP_PACKET) {
        return XDP_PASS;
    }

    u32 *pkt_count = bpf_map_lookup_elem(&xdp_stats_map, &ip_meta);
    if (!pkt_count) {
        // No entry in the map for this IP tuple yet, so set the initial value to 1.
        u32 init_pkt_count = 1;
        bpf_map_update_elem(&xdp_stats_map, &ip_meta, &init_pkt_count, BPF_ANY);
    } else {
        // Entry already exists for this IP tuple,
        // so increment it atomically.
        __sync_fetch_and_add(pkt_count, 1);
    }

    return XDP_PASS;
}
xdp_prog_func is fairly simple since we have already coded most of the program logic inside parse_ip_packet. What we do here is:
- Use
parse_ip_packetto parse the packet. - If it is not a TCP or UDP packet, return
XDP_PASSto skip counting. - Use the
bpf_map_lookup_elemhelper function to look up the IP:ports tuple in the BPF Map key. - If this is the first time seeing the IP:ports tuple, set the value to 1; otherwise, increment it by 1.
__sync_fetch_and_addis the built-in LLVM atomic increment operation.
Finally, we use the SEC("xdp") macro to attach this function to the XDP subsystem.
Writing the Userspace Program
It's time to delve deeper into the Go code again.
Here, we first load the generated eBPF program and use the `loadEbpfObjects` function to map it. Then, we use the `link.AttachXDP` function to attach the program to the specified network interface. Similar to the previous example, we use a channel to listen for interrupt signals and gracefully shut down the program.
//    main.go
//go:generate go run github.com/cilium/ebpf/cmd/bpf2go ebpf xdp.c

var (
    ifaceName = flag.String("iface", "", "network interface to attach XDP program to")
)

func main() {
    log.SetPrefix("packet_count: ")
    log.SetFlags(log.Ltime | log.Lshortfile)
    flag.Parse()

    // Subscribe to signals for terminating the program.
    stop := make(chan os.Signal, 1)
    signal.Notify(stop, os.Interrupt, syscall.SIGTERM)

    iface, err := net.InterfaceByName(*ifaceName)
    if err != nil {
        log.Fatalf("network iface lookup for %q: %s", *ifaceName, err)
    }

    // Load pre-compiled programs and maps into the kernel.
    objs := ebpfObjects{}
    if err := loadEbpfObjects(&objs, nil); err != nil {
        log.Fatalf("loading objects: %v", err)
    }
    defer objs.Close()

    // Attach the program.
    l, err := link.AttachXDP(link.XDPOptions{
        Program:   objs.XdpProgFunc,
        Interface: iface.Index,
    })
    if err != nil {
        log.Fatalf("could not attach XDP program: %s", err)
    }
    defer l.Close()

    log.Printf("Attached XDP program to iface %q (index %d)", iface.Name, iface.Index)
Next, we will read the map content every second and print the packet counts to standard output:
//    main.go
//    ...
    ticker := time.NewTicker(time.Second)
    defer ticker.Stop()
    for {
        select {
        case <-stop:
            if err := objs.XdpStatsMap.Close(); err != nil {
                log.Fatalf("closing map reader: %s", err)
            }
            return
        case <-ticker.C:
            m, err := parsePacketCounts(objs.XdpStatsMap, excludeIPs)
            if err != nil {
                log.Printf("Error reading map: %s", err)
                continue
            }
            log.Printf("Map contents:\n%s", m)
            srv.Submit(m)
        }
    }
}
We will use the utility function parsePacketCounts to read the map content and parse the packet counts. This function will iterate over the map content.
Since we will be getting raw bytes from the Map, we need to parse these bytes and convert them into a human-readable format. We will define a new type PacketCounts to store the parsed map content.
//    main.go
type IPMetadata struct {
    SrcIP   netip.Addr
    SrcPort uint16
    DstPort uint16
}

func (t *IPMetadata) UnmarshalBinary(data []byte) (err error) {
    if len(data) != 8 {
        return fmt.Errorf("invalid data length: %d", len(data))
    }
    if err = t.SrcIP.UnmarshalBinary(data[4:8]); err != nil {
        return
    }
    t.SrcPort = uint16(data[3])<<8 | uint16(data[2])
    t.DstPort = uint16(data[1])<<8 | uint16(data[0])
    return nil
}

func (t IPMetadata) String() string {
    return fmt.Sprintf("%s:%d => :%d", t.SrcIP, t.SrcPort, t.DstPort)
}

type PacketCounts map[string]int

func (i PacketCounts) String() string {
    var keys []string
    for k := range i {
        keys = append(keys, k)
    }
    sort.Strings(keys)

    var sb strings.Builder
    for _, k := range keys {
        sb.WriteString(fmt.Sprintf("%s\t| %d\n", k, i[k]))
    }

    return sb.String()
}
We define a new type IPMetadata to store the IP:ports tuple. We also define an UnmarshalBinary method to parse the raw bytes and convert them into a human-readable format. Additionally, we define a String method to print the IP:ports tuple in a human-readable format.
Then we define a new type PacketCounts to store the parsed map content. We also define a String method to print the map content in a human-readable format.
Finally, we will use the PacketCounts type to parse the map content and print the packet counts:
//    main.go
func parsePacketCounts(m *ebpf.Map, excludeIPs map[string]bool) (PacketCounts, error) {
    var (
        key    IPMetadata
        val    uint32
        counts = make(PacketCounts)
    )
    iter := m.Iterate()
    for iter.Next(&key, &val) {
        if _, ok := excludeIPs[key.SrcIP.String()]; ok {
            continue
        }
        counts[key.String()] = int(val)
    }
    return counts, iter.Err()
}
Running the Program
First, we need to compile the eBPF program and then run the userspace program.
  $ go generate
Compiled /Users/sazak/workspace/gocode/src/github.com/ozansz/intro-ebpf-with-go/0x03-packet-count/ebpf_bpfel.o
Stripped /Users/sazak/workspace/gocode/src/github.com/ozansz/intro-ebpf-with-go/0x03-packet-count/ebpf_bpfel.o
Wrote /Users/sazak/workspace/gocode/src/github.com/ozansz/intro-ebpf-with-go/0x03-packet-count/ebpf_bpfel.go
Compiled /Users/sazak/workspace/gocode/src/github.com/ozansz/intro-ebpf-with-go/0x03-packet-count/ebpf_bpfeb.o
Stripped /Users/sazak/workspace/gocode/src/github.com/ozansz/intro-ebpf-with-go/0x03-packet-count/ebpf_bpfeb.o
Wrote /Users/sazak/workspace/gocode/src/github.com/ozansz/intro-ebpf-with-go/0x03-packet-count/ebpf_bpfeb.go

$ go build -o packet_count
Now we can run it:
$ sudo ./packet_count --iface eth0
packet_count: 22:11:10 main.go:107: Attached XDP program to iface "eth0" (index 2)
packet_count: 22:11:10 main.go:132: Map contents:
192.168.5.2:58597 => :22 | 51
packet_count: 22:11:11 main.go:132: Map contents:
192.168.5.2:58597 => :22 | 52
packet_count: 22:11:11 main.go:132: Map contents:
192.168.5.2:58597 => :22 | 53
Packets arriving from the IP address 192.168.5.2 to port 22 are SSH packets because I am running this program within a VM and connecting via SSH.
Let's run curl inside the VM on another terminal and see what happens:
$ curl https://www.google.com/Meanwhile, in the first terminal:
packet_count: 22:14:07 main.go:132: Map contents:
172.217.22.36:443 => :38324  | 12
192.168.5.2:58597 => :22 | 551
packet_count: 22:14:08 main.go:132: Map contents:
172.217.22.36:443 => :38324  | 12
192.168.5.2:58597 => :22 | 552
packet_count: 22:14:08 main.go:132: Map contents:
172.217.22.36:443 => :38324  | 30
192.168.5.2:58597 => :22 | 570
1packet_count: 22:14:09 main.go:132: Map contents:
172.217.22.36:443 => :38324  | 30
192.168.5.2:58597 => :22 | 571
We see that packets arriving from the IP address 172.217.22.36 to port 38324 are the packets from the curl command.
Conclusion
eBPF is powerful in many ways, and I believe it is a technology worth investing time in, especially when it comes to system programming, observability, or security. In this article, we learned what eBPF is, how it works, and how to start using it with Go.
I hope you enjoyed this article and learned something new. If you have any questions, feel free to ask.
Translated from https://www.cnxct.com/an-applied-introduction-to-ebpf-with-go/
