Usually, image processing software will provide blur filter to make images blur.


There are many algorithms to implement blur, one of them is called Gaussian Blur Algorithm. It utilizes Gaussian distribution to process images.
This article is to introduce Gaussian Blur algorithm, you will find this is a simple algorithm. In fact, it is a kind of data smoothing which can be used in many situations.
1. Gaussian Blur theory
The so called blur can be understood as taking a pixel as the average value of its surrounding pixels.
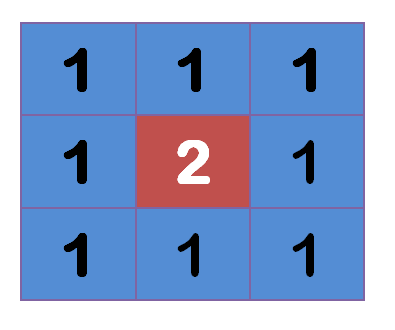
On the above graph, 2 is the center point, the surrounding points are 1.
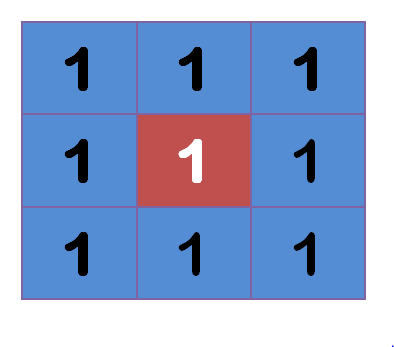
 The center point will take the average value of its surrounding points, it will be 1. From value perspective, it's a smoothing. On graphic, it's a blur effect. The center point will lose its detail.

Obviously if the value range is very large, the blur effect is very strong.
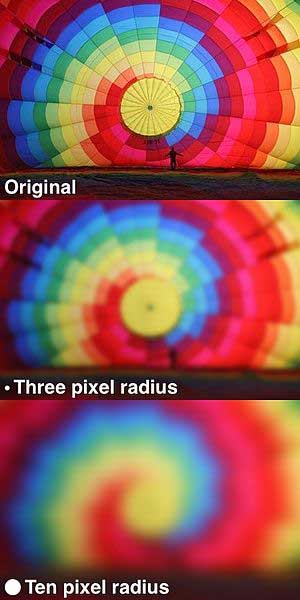
The above are graphs of original, 3 pixels blur radius and 10 pixels blur radius. The bigger the blur radius, the more blur the picture is.
The question now is if every point will get the average value of surrounding points, then how should we allocate weight?
If we just use simple average, it's unreasonable, because images are continuous, the closer the points in distance, the closer the relationship between points. Hence the weighted average is more reasonable than simple average, the close the points in distance, the larger the weight.
2. Weight of normal distribution
Normal distribution is an acceptable weight distribution model.
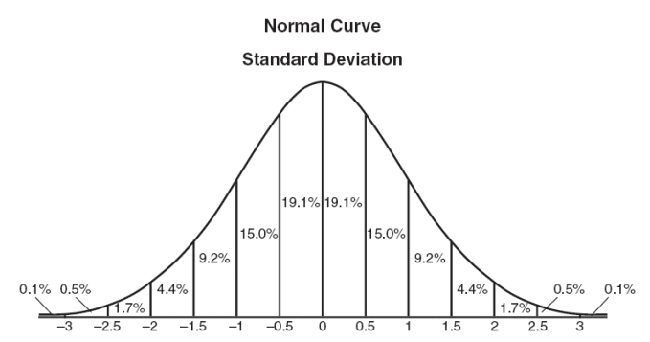
On graphic, normal distribution is a Bell-shaped curve, the closer to the center, the bigger the value.
3. Gaussian function
The normal distribution above is one dimensional, the graph is two dimensional. We need two dimensional normal distribution.
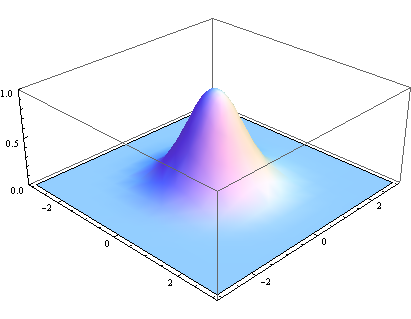
The density function of normal distribution is called Gaussian function. The one dimension format is :
Here μ is the average of x, Because center point is the origin point when calculating average value, so μ equals to 0.
Based on the one dimension function , we can derive the two dimensional Gaussian function.
With this function, we can calculate the weight of each point.
4. Weight matrix
Assume the coordinate of the center point is (0,0), then the coordinates of 8 points which are nearest to it are:
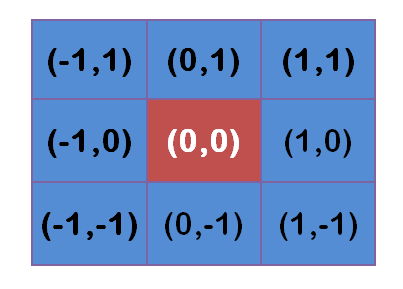
To calculate the weight matrix, we need to set the value of σ, σ=1.5, then the weight matrix of blur radius 1 is
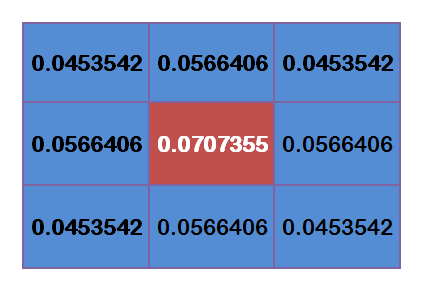
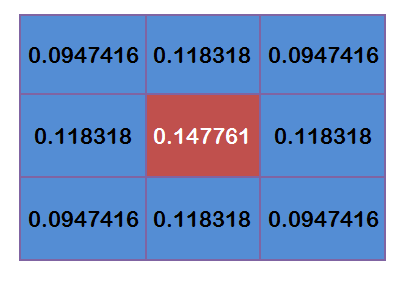
The sum of the weights of these 9 points is 0.4787147. If only calculate the Weighted average of these 9 points, then the sum should be 1, hence the above 9 values should divide 0.4787147.
5. Calculate Gaussian Blur
With weight matrix, we can calculate the value of Gaussian Blur.
Assume we have 0 pixels now, the gray value(0-255):
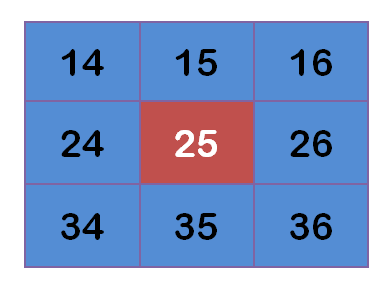
Each point multiplies its weight value:
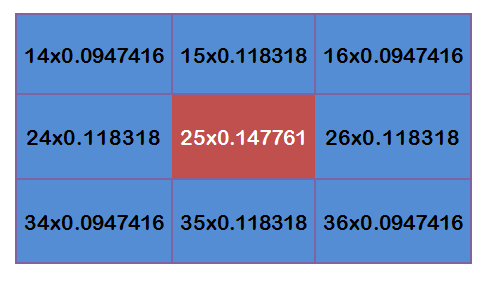
Now we have:
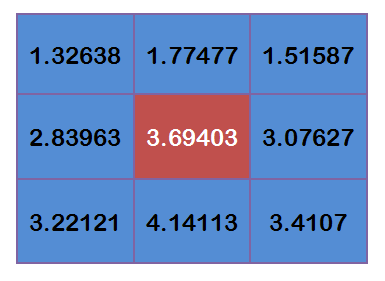
Add these 9 values up, we will get the Gaussian Blur value of the center point.
Repeat this process for all other points, then we will get graph after Gaussian blur.
6. The process for the points at borders
If a point is at the border, there are not enough points, what should we do?
One solution is to copy all the existing points to respective places to form a new matrix.
Reference : http://www.ruanyifeng.com/blog/2012/11/gaussian_blur.html
